 Quantum Bias
SectionsAll articles
Tested ideas for NQ and ES traders
Every article states its data, its method and its limits, with sources you can check.
 Daily Bias
 Trading: Does a Close Above Last Week's High Work?
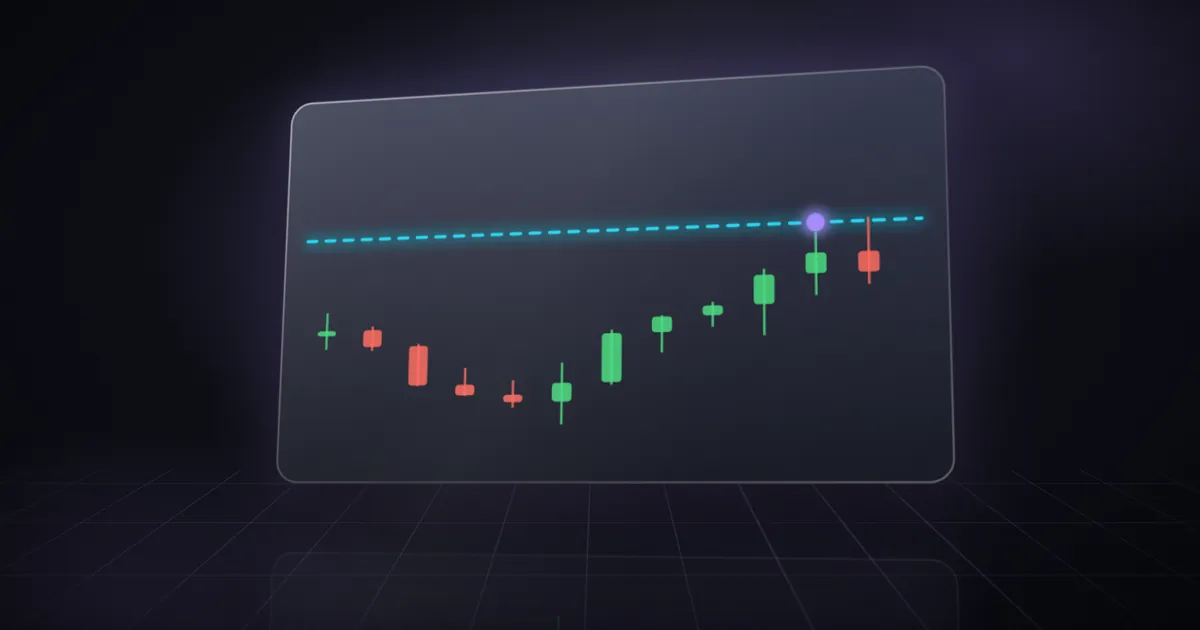
A popular bias rule says a close above the prior high is bullish. On 1,403 Nasdaq-100 weeks, the level was revisited far more often, but the next week did not rise more often.
 Daily Bias
 vs Macro Bias: Which Pre-Market Read to Trust on NQ?
A quantitative read and a macro read answer different questions. On 8 of the 9 shared mornings with a directional macro read, our two NQ reads pointed in opposite directions. Here is why.
 Daily Bias
Previous Week High Breakout: Tested on the S&P 500 and 7 Stocks
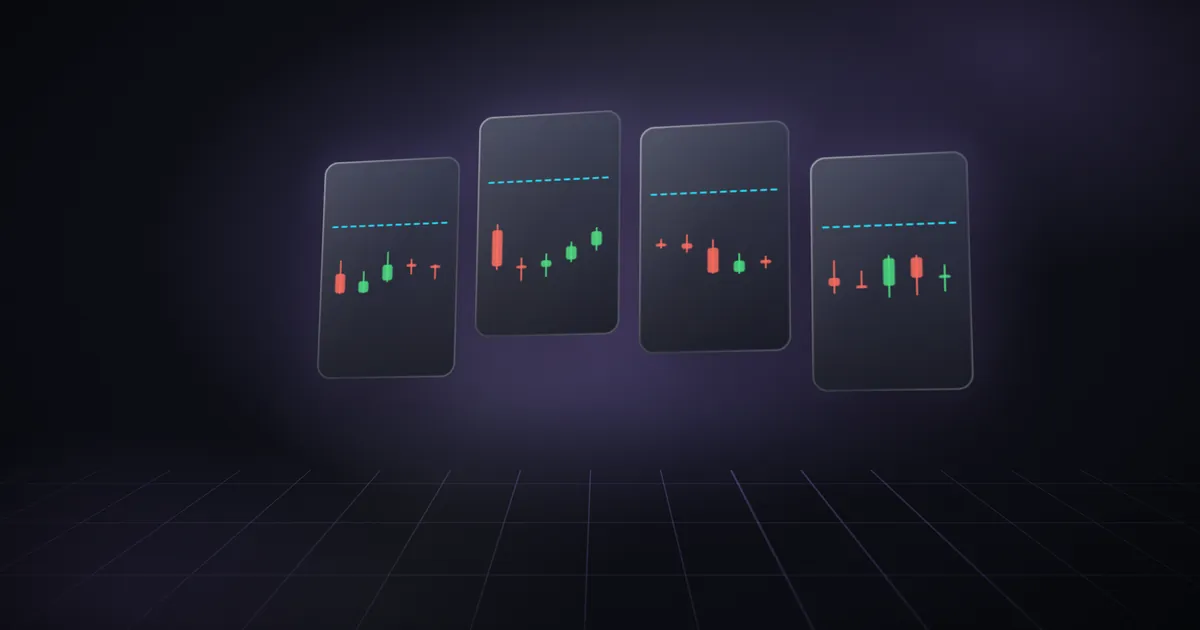
We tested the popular prior-high/prior-low bias rule on SPY and seven mega-cap stocks. The level was revisited almost everywhere; the directional edge did not show up anywhere.
 Daily Bias
How Much Does the S&P 500 Move in a Week? Typical Weekly Ranges
A normal week moves the S&P 500 about 2.7% from high to low, the Nasdaq-100 about 3.8% and Tesla about 10%. Ranges for 9 markets, and how to use them alongside a daily bias.
 Macro
Interest Rates and the Nasdaq: Do Rising Yields Hurt Tech Stocks?
"Higher yields hurt tech" is true only some of the time. From 2000 to 2026, the link between the 10-year yield and the Nasdaq-100 changed sign with the regime.
 Macro
Fed Rate Cut: What Happens to Stocks After the First Cut?
After the Fed's first cut, the S&P 500 fell 10–14% over a year twice and rose 8–18% twice. The difference was a recession. Every first cut and hike since 2000, measured.
 Macro
Recession and the Stock Market: When Do Stocks Bottom?
Every S&P 500 decline of 10% or more since 1999, set against official recession dates. The market peaked before every recession, and bottomed before two of the three ended.
 Macro
Pre-Market Checklist for NQ Futures: 8 Checks Before the Open
A pre-market macro checklist for NQ futures: the calendar, overnight futures, chip leaders, yields, the dollar and the Fed, checked before 09:30 ET.
 Macro
FOMC Week Trading: Does the Fed Cycle Still Move the Nasdaq?
A 2019 study found stocks earn their premium in even weeks of the Fed cycle. We retested it on the Nasdaq-100 from 2017 to 2026. It did not hold.
 Session Stats
NQ Futures Trading Hours: Asia, London and New York Sessions
NQ futures trading hours in Eastern Time: Sunday 6 p.m. to Friday 5 p.m. ET, the Asian, London and New York sessions, and the hours that matter most.
 Session Stats
First and Last 30 Minutes of Trading: What the Research Shows
Two peer-reviewed studies found that the first part of the trading day predicts the last half-hour, in the S&P 500 and in 60+ futures markets. What it means for NQ.
 Session Stats
Overnight vs Intraday Returns: When Does the Nasdaq Really Rise?
Studies found the Nasdaq-100 ETF earned its gains overnight and lost during the day from 1999 to 2006. What the research shows, why it may happen, and what it means for NQ.
 Session Stats
Monday Effect: Is Monday the Worst Day for Stocks?
In 1980, research showed that S&P 500 returns from Friday's close to Monday's close were negative on average. Later studies found the effect faded once it was known. What it means for ES and NQ traders today.
 Session Stats
Best Time to Buy Stocks? 4 Days a Month That Carried the Market
Is there a best time to buy stocks? From 1926 to 2005, U.S. stocks averaged 0.15% a day around the turn of the month and about zero on the other 16 days.
 Concepts Tested
Buy the Dip After a Market Crash? What 81 Big Nasdaq Drops Show
Buy the dip after a market crash? We tested every Nasdaq-100 week down 5% or more since 1999: a short bounce, no lasting edge, and no bounce in downtrends.
 Concepts Tested
Buying Stocks at a 52-Week High: Is It Really Dangerous?
Buying at a record feels risky. After 335 weekly closes at a 52-week high, the S&P 500 rose over the next quarter 71% of the time, about the same as any week. What research and our data show.
 Concepts Tested
Stock Market Prediction: Does January Predict the Whole Year?
Can January predict the stock market? Since 2000, January matched the rest of the S&P 500's year 15 times out of 26, worse than simply expecting a rise.
 Concepts Tested
Trading Signals vs Quantitative Research: Are Signals Worth It?
Quantitative research measures how markets behaved; signals tell you what to do. Learn the difference and 6 questions to ask any research provider.
 Concepts Tested
Sell in May and Go Away: Does It Work on the Nasdaq-100?
The Halloween effect was found in 36 of 37 markets. We tested it on the Nasdaq-100 from 2000 to 2026: summer months beat winter months.
 Psychology
Hindsight Bias in Trading: Why Replays Make You Overconfident
Once you know how a session ended, the setup looks obvious. Research from Fischhoff to Biais and Weber shows why, and how hindsight bias hurt bankers' performance.
 Psychology
Why Traders Cut Winners and Hold Losers (Disposition Effect)
Investors sell winning positions far more readily than losing ones. What 40 years of research shows, from 10,000 brokerage accounts to professional futures traders.
 Psychology
How to Stop Overtrading: What 66,465 Brokerage Accounts Reveal
The households that traded most earned 11.4% a year against 17.9% for the market. What the research on overconfidence shows, and how traders can measure their own.
 Psychology
Loss Aversion in Trading: Why Losses Hurt Twice as Much
In Tversky and Kahneman's experiments, losses weighed about 2.25 times as much as equal gains. Professional futures traders showed the related bias more than students. What loss aversion does to traders, and how to limit it.
 Psychology
FOMO in Trading: Why Traders Chase the Stocks in the News
Individual investors are net buyers of attention-grabbing stocks: those in the news, with abnormal volume or extreme moves. Institutions are not. What Barber and Odean found, and how to keep headlines from choosing your trades.
 Indicators
Moving Average Strategy Tested: The 10-Month Rule on the Nasdaq
Faber's 10-month moving average rule, replicated on the Nasdaq-100: a 25% worst drawdown instead of 75%, more return since 2000, but less since 2013.
 Indicators
RSI Trading Strategy Tested: Does Overbought Really Mean Sell?
The classic RSI trading strategy, sell above 70 and buy below 30, tested on 26 years of weekly Nasdaq-100 data. Overbought rarely meant sell.
 Indicators
Nasdaq vs S&P 500 (NQ vs ES): 27 Years of Relative Strength
QQQ and SPY have a weekly correlation of 0.85, but they do not always move in proportion. What weekly data since 1999 shows about beta, leadership and whether relative strength persists.
 Indicators
MACD Trading Strategy Tested: Does the Crossover Work?
The classic MACD trading strategy, tested on 26 years of weekly S&P 500 data and seven mega-caps: it earned 2.5% a year against 8.4% for simply holding.
 Indicators
Volatility Clustering and Position Sizing for ES, NQ and Stocks
Calm months tended to be followed by calm months and wild ones by wild ones, but less wild. On the S&P 500, volatility was far more predictable than direction. What it means for sizing and stops.
 Tech / AI
Nasdaq-100 Top 10 Holdings and Weights: Nvidia Is Not 14%
Ten companies made up 46.86% of the Nasdaq-100 on September 30, 2026. Nvidia's official weight was 8.36%, not the 14% often quoted. What the cap rules are and why they matter to NQ traders.
 Tech / AI
Semiconductor Stocks and the Nasdaq: Do Chips Lead NQ?
We compared the semiconductor ETF SOXX with QQQ every week since 2001. In 88 weeks when chips moved 8% or more, the Nasdaq-100 moved the same way every time, at about 0.6 times the size.
 Tech / AI
Nvidia Stock and the Magnificent 7 vs the S&P 500: Worth the Risk?
Nvidia stock returned 35.6% a year since 1999 but fell 88% along the way. How Nvidia and the Magnificent 7 compare with the S&P 500 on return and risk.
 Tech / AI
Nvidia Stock Split: Do Stocks Really Go Up After a Split?
Nvidia's 2021 and 2024 stock splits beat the S&P 500 in their announcement week but trailed it a year later. What six big-tech splits show.
 Tech / AI
Nvidia Earnings: Do They Move the Whole Nasdaq-100?
Headlines say Nvidia earnings move the Nasdaq. We tested 43 reports since 2016: Nasdaq-100 weeks with an Nvidia report were no bigger than other weeks.