 Quantum Bias
Daily Bias Trading: Does a Close Above Last Week's High Work?
Price hitting your level and the market going your way aren't the same thing. Here's the data.
In this article
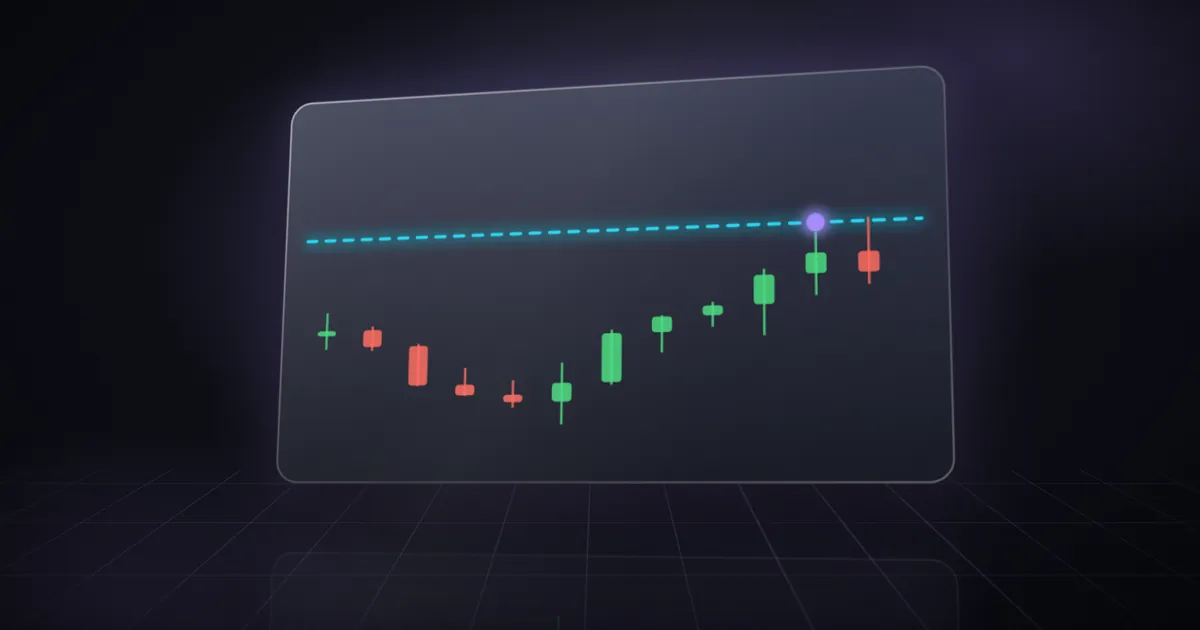
The rule predicts the level, not the direction. Across 1,403 weeks of Nasdaq-100 data, a weekly close above the prior week's high was followed by a move above that high 82.5% of the time. But the next week didn't rise any more often than a normal week, and on average it gained less.
| Question | Data | Answer |
|---|---|---|
| Does a close above the prior high lead to a higher next week? | QQQ weekly prices, Nov 1999 – Oct 2026, 1,403 weeks | No: +0.13% on average, against +0.23% for all weeks |
| Does it lead to that high being taken out? | Same | Yes: 82.5% of the time, against 61.1% for all weeks |
Where the rule comes from
You've probably heard this one a hundred times: if today closed above yesterday's high, lean bullish. If it closed below yesterday's low, lean bearish. It's big with followers of ICT (Inner Circle Trader, the teaching brand of Michael J. Huddleston) and of the trader-educator known as TTrades. TradingView user joshuuu even turned it into a public indicator, daily bias @ttrades x joshuuu, published on August 9, 2023. The script also handles wicks that poke past a prior extreme and close back inside.
We tested the core of the idea: the close outside the prior range. We don't have long daily history yet, so we ran it one level up, on weekly bars:
- a week that closes above the prior week's high is "bullish";
- a week that closes below the prior week's low is "bearish";
- everything else is "inside".
The time frame is different, and we cover that in the limits. But the logic is the same at any scale: a close outside the prior range is supposed to tell you which way the next period leans.
What we found
From November 1999 to October 2026, 35% of weeks closed above the prior week's high, 20% closed below the prior week's low, and the other 44% closed inside.
| Signal | Weeks | Next week, average | Next week up | Next week trades beyond this week's extreme |
|---|---|---|---|---|
| Close above prior high ("bullish") | 497 | +0.13% | 55.7% | Above the high: 82.5% |
| Close below prior low ("bearish") | 287 | +0.59% | 56.1% | Below the low: 70.0% |
| Inside | 619 | +0.15% | 56.4% | — |
| All weeks | 1,403 | +0.23% | 56.1% | Above the high: 61.1% · Below the low: 43.7% |
Exact values from table 2 in this article. Bar lengths share a zero baseline; no new calculation or simulated price path. Read the table and its stated sample and limits in this article.
The level part of the rule holds up. After a bullish close, the next week traded above that week's high 82.5% of the time, compared with 61.1% for a normal week. After a bearish close, it traded below the low 70.0% of the time, compared with 43.7%. So yes, the level the rule points to really does tend to get hit.
The direction part doesn't hold up. After a bullish close, the next week finished higher 55.7% of the time. Any week finished higher 56.1% of the time. The average return was actually below normal.
The bearish side is the real surprise. Weeks after a close below the prior low gained 0.59% on average, more than double a typical week. To see if that could just be luck, we drew 287 weeks at random 10,000 times. Only 2.2% of those draws did as well. On the Nasdaq-100, a weekly breakdown was more often followed by a bounce than by more selling.
Why both findings can be true
At first, these two results look like they contradict each other. They don't once you look at where the next week starts. A week that closes above its prior high usually closes near its own high, so the next week opens just under that level. Trading a few ticks above it is almost baked in. Where the week finishes is a whole different question.
That's the most useful lesson here if you trade with a bias: price touching a level and the direction being right are two different events. A recap that only counts "level reached" can look great even when the directional call adds nothing. Whenever you review a bias, ours included, track both.
Did the pattern change over time?
We split the sample in two halves:
| Period | Bullish close → next week | Bearish close → next week | All weeks |
|---|---|---|---|
| 1999–2012 | 0.00% | +0.49% | +0.07% |
| 2013–2026 | +0.24% | +0.70% | +0.39% |
It held in both. A bullish weekly close was followed by a below-average week in each period, and a bearish close by an above-average week.
What this means if you trade NQ
- Use the prior high and low as reference levels, not forecasts. The data backs the idea that a nearby extreme tends to get revisited, and not much more.
- Don't mistake a close outside the range for a directional edge. On weekly Nasdaq-100 bars, there was none on the upside, and on the downside it went the other way.
- Judge your bias by where the session ends, not just by what it touched. Two columns in your journal, "level reached" and "direction right", will tell you more than one.
That's also why a solid daily bias needs both reference levels and a clear invalidation. Levels tell you where the market may react. They don't tell you which side wins.
Why breakdowns tended to bounce on this index
A weekly close below the prior low shows selling pressure, and on a single stock that pressure can last for months. On the Nasdaq-100 between 1999 and 2026, it mostly didn't. We see three likely reasons.
First, the index went up a lot over the period, so any rule that sells weakness was swimming against the current. Second, sharp weekly drops often come from one event, like a bad earnings report or a macro surprise, and the market partly reverses it once it's digested. Third, a lot of long-term holders of the index buy the dip, which supports prices after a decline.
None of this guarantees the next bounce. It just explains why, on this index, a bearish weekly close wasn't a reliable reason to expect more downside.
How to test the rule on your own daily chart
All you need is a spreadsheet and a daily price export:
- For each day, mark "bullish" if the close is above the prior day's high, "bearish" if it's below the prior day's low, and "inside" otherwise.
- For the next day, record two things: did price trade past the level, and did the day close up or down?
- Compare the share of up days after "bullish" days with the share of up days overall.
- Do it again for the window you actually trade, for example 9:30 to 12:00 ET.
If "level reached" scores high while "closed up" is no better than average, you're seeing the same pattern we found on weekly data.
Limits
- Weekly, not daily. People usually apply this rule to daily bars and intraday entries. A daily test could give a different answer. It needs daily history we plan to add.
- QQQ, not NQ. Both track the same index, but the futures trade almost around the clock, so their weekly highs and lows can differ a bit.
- Price levels, not trades. "The next week traded above the high" says nothing about the prices where a trader could have gotten in or out.
- One market. The Nasdaq-100 went up a lot over most of the sample, which favors bounces after declines.
How we did it
- QQQ weekly open, high, low and close from Alpha Vantage (
TIME_SERIES_WEEKLY), November 1999 to October 9, 2026, adjusted by us for the two-for-one split of March 20, 2000. - Weekly returns include dividends on their ex-dates (Alpha Vantage
DIVIDENDS). - Random comparison: 10,000 draws of the same number of weeks, with a fixed seed so anyone can reproduce the result.
Sources
- joshuuu. (2023, August 9; updated August 10, 2023). daily bias @ttrades x joshuuu [TradingView indicator]. TradingView. tradingview.com/script/ezS0ydMQ
- Alpha Vantage. Time Series Stock Data APIs: TIME_SERIES_WEEKLY and DIVIDENDS. Data retrieved October 2026.
FAQ
What is the previous high and low bias rule? A close above the prior period's high is read as bullish, a close below the prior low as bearish. Traders then look for price to come back to that level.
Does a close above the previous high mean the market will go up? On weekly Nasdaq-100 data from 1999 to 2026, no. The next week rose 55.7% of the time, about the same as any week.
Is the high likely to get taken out again? Yes. After a weekly close above the prior high, the next week traded above that week's high 82.5% of the time.
Does this apply to daily charts? We tested weekly bars. A daily test is coming once we add daily history.
Research and education only. Not financial advice. Past results do not predict future returns. A backtest is not real performance.
How this article was made: drafted with AI assistance from public data and the sources listed above; facts and figures checked by Gabriel Décarie and Karel Panneton.
The week just closed, summarized, and the economic calendar for the week ahead.