 Quantum Bias
Volatility Clustering and Position Sizing for ES, NQ and Stocks
One of the few things in markets you can actually forecast, and what it can't tell you.
In this article
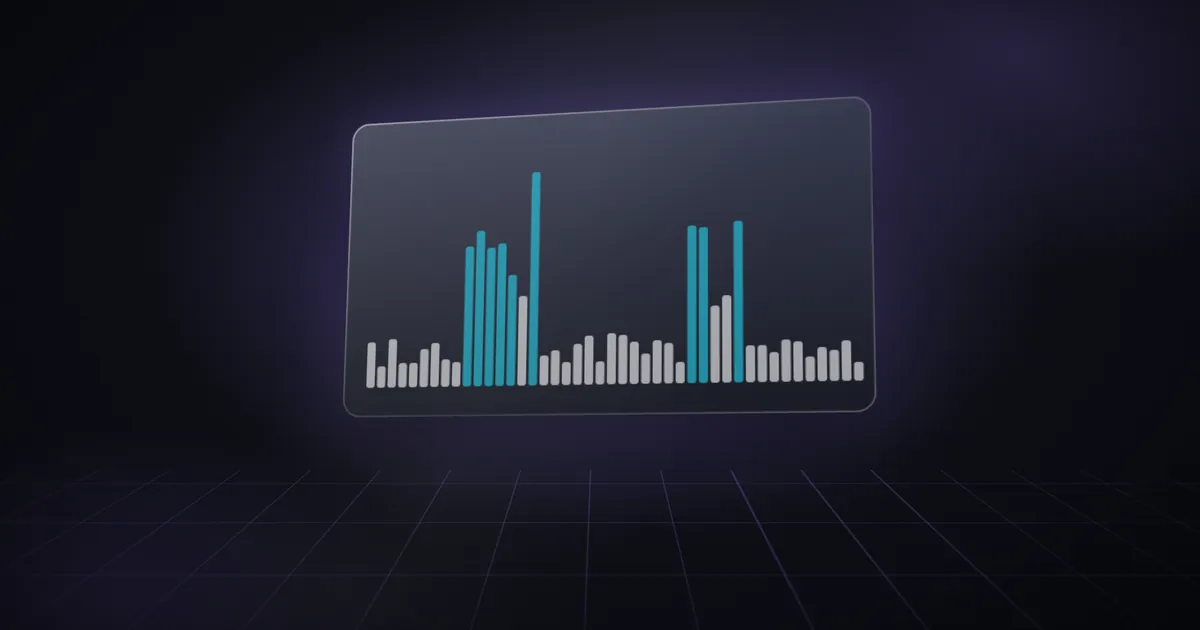
Volatility is way more predictable than direction. On weekly S&P 500 data since 2000, the calmest fifth of four-week periods (about 5% annualized volatility) was followed by four weeks at about 8.5%. The wildest fifth (about 27%) was followed by four weeks at about 16.5%. Volatility stuck around, then partly faded. What it didn't do was predict direction: returns after the calmest and the wildest periods were both positive on average, but the wild ones came with double the spread.
| Question | Data | Answer |
|---|---|---|
| Does recent volatility predict future volatility and returns? | SPY and seven mega-caps, weekly, 2000–2026 | Volatility: yes, partly (correlation 0.43 on SPY). Direction: no clear link |
The idea
In The Variation of Certain Speculative Prices (Journal of Business, 1963), Benoit Mandelbrot observed that in price series, "large changes tend to be followed by large changes, of either sign, and small changes tend to be followed by small changes". In 1982, Robert Engle gave the idea a statistical model, autoregressive conditional heteroscedasticity (ARCH), in a paper published in Econometrica. That work earned him a share of the 2003 Nobel prize in economics. Today it's called volatility clustering.
It's one of the most solid facts in finance, and one of the most useful for traders, because volatility drives risk, stops and position size. We measured how strong it's been on the S&P 500 and on seven of the biggest stocks.
How we measured it
- Realized volatility: the standard deviation of the last four weekly returns, annualized (× √52).
- Next volatility: the same measure over the next four weeks.
- Groups: all four-week periods sorted into fifths, from calmest to wildest.
- Returns: the next four weeks' return, dividends included, its average, share positive and spread (standard deviation).
Results on the S&P 500
| Volatility group (last 4 weeks) | Median volatility, last 4 weeks | Median volatility, next 4 weeks | Next 4 weeks, average return | Share positive | Spread of next 4-week returns |
|---|---|---|---|---|---|
| Calmest fifth | 5.1% | 8.5% | +0.88% | 68.2% | 2.7% |
| Second | 8.6% | 10.4% | +0.87% | 66.3% | 4.0% |
| Middle | 11.8% | 11.2% | +0.30% | 56.6% | 3.9% |
| Fourth | 16.1% | 12.9% | +0.43% | 64.5% | 5.7% |
| Wildest fifth | 26.9% | 16.5% | +1.15% | 60.4% | 6.0% |
Exact values from table 2 in this article. Bar lengths share a zero baseline; no new calculation or simulated price path. Read the table and its stated sample and limits in this article.
Three findings.
1. Volatility stuck around. The next month's volatility went up steadily from the calmest group to the wildest. The correlation between one four-week volatility reading and the next was 0.43, which is a strong relationship for anything in markets.
2. But it drifted back toward normal. Calm periods were followed by somewhat higher volatility (5% → 8.5%), and wild periods by lower volatility (27% → 16.5%). Neither extreme fully lasted. If you assume this month's volatility will just continue, you'll be wrong both ways, but less wrong than someone who ignores it.
3. You couldn't predict direction from volatility. The average next-month return was positive in every group, and highest after the wildest periods (+1.15%). But the spread of outcomes after wild periods was more than double what it was after calm ones (6.0% vs 2.7%). That higher average came from sitting through much bigger swings, often in the middle of bear markets.
Results on single stocks
| Stock | Correlation of 4-week volatility with the next 4 weeks |
|---|---|
| Nvidia | 0.46 |
| S&P 500 (SPY) | 0.43 |
| Amazon | 0.42 |
| Apple | 0.32 |
| Microsoft | 0.31 |
| Alphabet | 0.21 |
| Meta | 0.19 |
| Tesla | 0.19 |
Clustering showed up in every stock, but it was weaker for several of them. Single stocks get more one-off jumps, like earnings reports, that spike volatility for a week without lasting. The index, which averages hundreds of companies, reflects broader market regimes that stick around.
On Nvidia, the wildest fifth of periods had a median of about 93% annualized volatility, followed by about 64%: still extreme, but well below the peak.
The calm-market trap
The table also has a warning for quiet markets. After the calmest fifth of periods, the next month's volatility was, in the median, about two-thirds higher (5.1% to 8.5%). Calm didn't last as long as it felt like it would.
That matters because calm periods tempt you into bigger positions: stops rarely get hit, ranges are tight, and risk looks small. If you size up because the last few weeks were quiet, you're adding exposure right when volatility is more likely to go up than down. The same inverse-volatility logic that cuts size in wild markets argues for some restraint in very calm ones, for example by capping size instead of letting it grow with no limit.
Why volatility clusters
- Information comes in bunches. Crises, policy changes and earnings seasons deliver news over weeks, not in a single day.
- Leverage and forced trading. Falling prices trigger margin calls and risk cuts, which create more selling and more volatility.
- Options hedging. As we explain in our intraday momentum article, dealers who are short gamma trade in the direction of moves, which amplifies volatility when it's already high.
What this means if you trade ES, NQ or stocks
Size positions by recent volatility. If last month was twice as volatile as normal, next month will probably be more volatile than normal too. Keeping the same size means taking more risk. Scaling down when volatility rises keeps your risk roughly stable.
Set stops based on current volatility. A stop that worked in a calm month can be noise in a wild one. Tools like the average true range (ATR), which J. Welles Wilder Jr. introduced in 1978, do this automatically.
Don't read high volatility as a direction. On this data, wild periods were followed by both the best and the worst months. Volatility tells you how much, not which way.
Expect it to fade, not to calm down overnight. After a shock, volatility tends to come down over weeks, not overnight. Our weekly range article gives typical ranges in normal conditions to compare against.
A simple sizing rule you can check
- Each week, compute the annualized volatility of the last four or eight weekly returns.
- Set position size inversely to it: if volatility doubles, cut size in half.
- Track the dollar swing of your position from week to week. It should stay roughly the same through calm and wild periods.
This doesn't try to predict direction. It just keeps the risk you take in line with the market you're in.
Limits
- Four weekly returns give a noisy volatility estimate. Daily data would give sharper readings.
- Overlapping windows. Back-to-back four-week periods share data.
- Survivor stocks for the single-stock results.
- Realized, not implied, volatility. We didn't test the VIX or options-based measures.
How we did it
- Weekly adjusted prices for SPY and seven mega-caps from Alpha Vantage (
TIME_SERIES_WEEKLY_ADJUSTED), through October 9, 2026. - Realized volatility: standard deviation of the last four weekly returns × √52; groups by fifths of all periods.
Sources
- Mandelbrot, B. (1963). The variation of certain speculative prices. Journal of Business, 36(4), 394–419. https://doi.org/10.1086/294632
- Engle, R. F. (1982). Autoregressive conditional heteroscedasticity with estimates of the variance of United Kingdom inflation. Econometrica, 50(4), 987–1007. IDEAS/RePEc
- Nobel Prize Outreach. (2003). Robert F. Engle III: Facts. nobelprize.org. Accessed October 12, 2026.
- Wilder, J. W., Jr. (1978). New Concepts in Technical Trading Systems. Trend Research. (Origin of the average true range.)
- Alpha Vantage. TIME_SERIES_WEEKLY_ADJUSTED (SPY and seven mega-caps). Data retrieved October 2026.
FAQ
What is volatility clustering? The tendency for high-volatility periods to be followed by high volatility and calm periods by calm, at least for a while.
Does high volatility predict lower stock prices? Not on our data. After the most volatile periods, the S&P 500's next four weeks averaged +1.15%, but with more than double the usual spread.
How long does high volatility last? It tends to fade over weeks. On the S&P 500, the wildest fifth of four-week periods (about 27% volatility) was followed by four weeks at about 16.5%.
Should I reduce position size when volatility is high? Scaling size inversely to recent volatility keeps your risk more stable. It doesn't predict direction.
Is volatility clustering stronger for stocks or indexes? In our sample, it was stronger for the S&P 500 and Nvidia than for Tesla, Meta or Alphabet.
Research and education only. Not financial advice. Past results do not predict future returns.
How this article was made: drafted with AI assistance from public data and the sources listed above; facts and figures checked by Gabriel Décarie and Karel Panneton.
The week just closed, summarized, and the economic calendar for the week ahead.