
Quantitative market research.
For the New York session.
Daily reports before the New York open. Seasonal studies every week. Your research, in one place.
Analysis and education only. Futures trading involves substantial risk of loss.
Five resources to prepare for the market.
Prepare your mornings with the Daily NQ and ES reports and Macro Bias, explore the week's top seasonal selections, and complete your research with free tools.
Daily NQ & ES market map.
Your NQ and ES reports, ready in your dashboard each trading morning before the New York open. NQ and ES (Micro and Mini) in the same membership.

Morning Market Journal.
Your morning market briefing for NQ and ES. Key overnight developments, economic events and sourced context, together in one concise report.
Seasonal Bias
Each week, receive the two highest-ranked eligible seasonal selections from our model for the same week, with historical results, charts and company research.
Free indicators on TradingView.
Two free tools for your TradingView charts: QB Oscillator for NQ–ES leadership and QB Institutional Flow for volume-based flow.
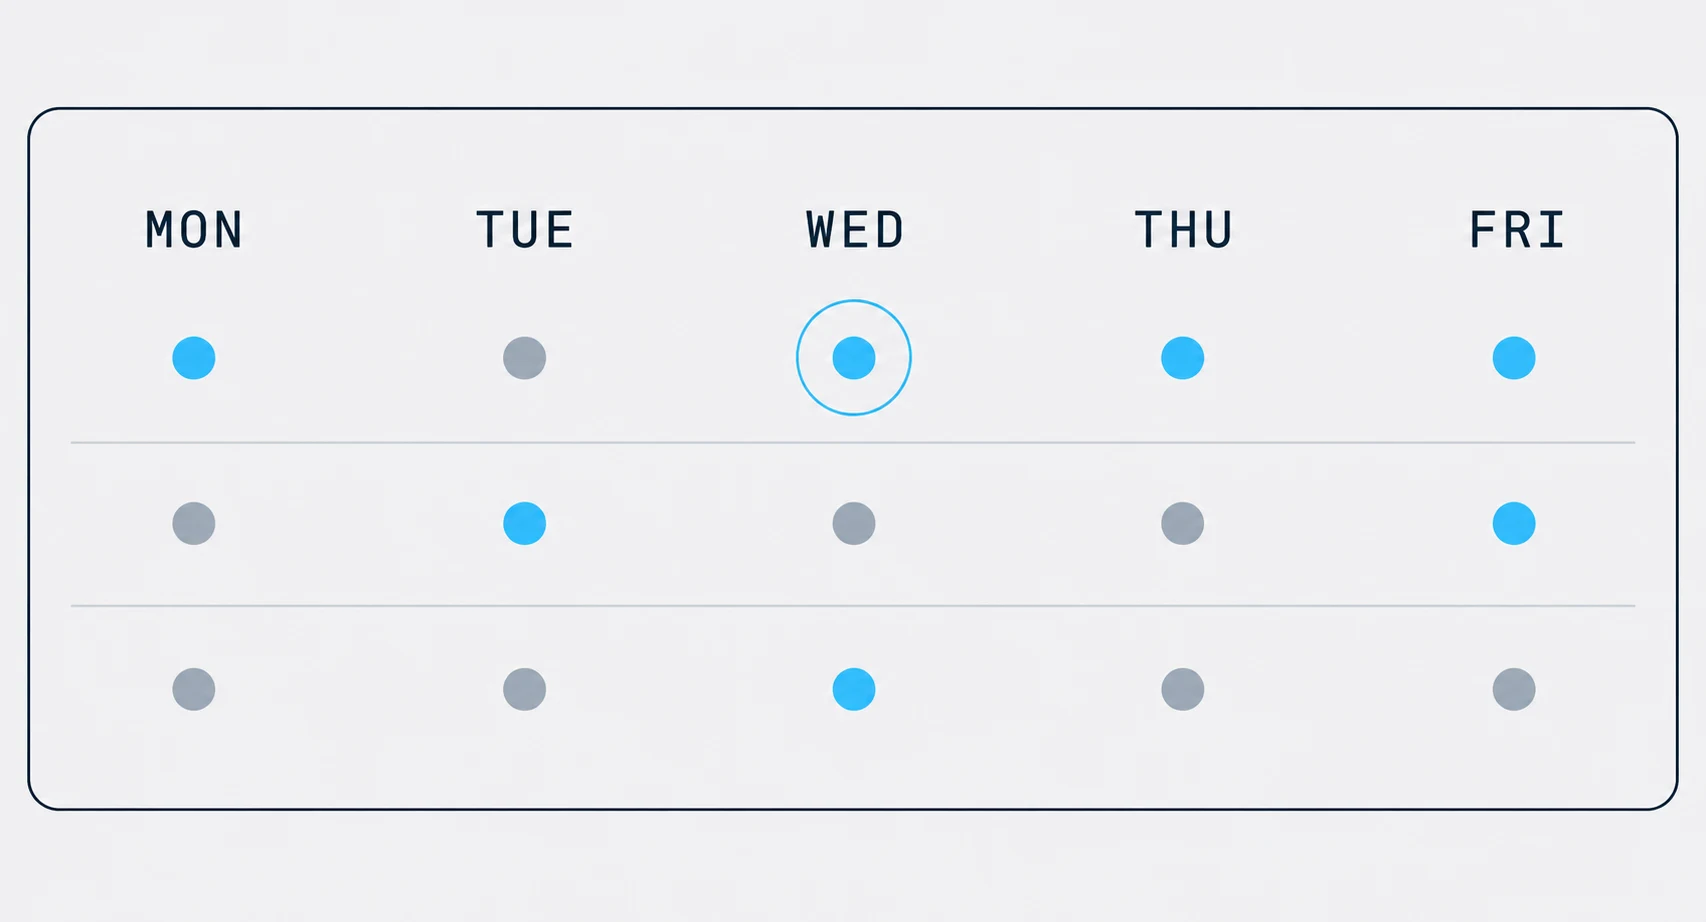
Your week, prepared.
Catch up on the week's markets and prepare for the next with a concise recap and economic calendar. Free with an account.
NQ. The official record.
The official NQ results from 2018 to August 2026, in points.
- Plans
- 1,746
- Net points
- 93,274
- Level 1 reached
- 71%
- Level 2 or 3 reached
- 60%
Theoretical engine replay on corrected historical data. No fees or slippage. These are historical model results, not executed trades or a record of published reports. Past results do not guarantee future performance.
Explore the full track recordAn advanced quantitative model
Session data and predefined rules, translated into structured pre-market research.
Detect the patterns
Overnight patterns detected before 9:30 ET; the most probable one is retained.
Establish the context
A probability-weighted bull or bear context, with confidence capped by design.
Map the levels
A rejection zone and three documented levels, derived from that context.
Publish, then score
Published before the open and unchanged afterwards. Scored 09:30–12:00 ET, then archived.
